Where to Find Data on Your Ideal Customer
Sally Armstrong
Government Data
Canada
Government data sources are a great place to find basic information on your ideal customer. Statistics Canada has a Population and Demography website that provides population data broken down by age, sex, families, households, and marital status. Here are a few other offerings from Statistics Canada that might interest you:
-
-
A complete list of the subjects covered by Statistics Canada
-
-
-
This publication brings together and analyzes a wide range of data sources in order to provide information on various aspects of Canadian society, including labour, income, education, social, and demographic issues, that affect the lives of Canadians.
-
-
Gender, Diversity and Inclusion Statistics
-
This publication provides data on topics such as gender and sexual orientation, indigenous peoples, persons with a disability, and visible minorities.
-
The United States
The United States Census Bureau will be your main source for demographic data related to the United States. You can explore the US Census Data here. If you are looking for charts that have already been created, there are Infographics & Visualizations available for data going back to 2008.
The U.S. Bureau of Labor Statistics (BLS) is the principal federal agency responsible for measuring labour market activity, working conditions, and price changes in the economy.
-
The Occupational Outlook Handbook can help you find career information on duties, education, and training, pay, and the outlook for hundreds of occupations.
-
Subject areas covered by BLS include employment, unemployment, inflation and prices, and productivity. A list of all available subject areas can be found here.
The National Center for Education Statistics (NCES) is the primary federal entity for collecting and analyzing data related to education.
Data USA is a comprehensive data tool developed by Deloitte, Datawheel, and Cesar Hidalgo providing visual representations to understand and visualize the critical issues facing the United States in areas like jobs, skills, and education across industry and geography.
Pew Research Center is a nonpartisan fact tank that informs the public about the issues, attitudes and trends shaping the world. They conduct public opinion polling, demographic research, content analysis and other data-driven social science research.

Global
World Bank Open Data provides free and open access to global development data. You can browse the data by countries and economies or indicators. An example of an indicator could be education or poverty.
The World Factbook provides information on the history, people, government, economy, geography, communications, transportation, military, and transnational issues for 267 world entities.
The World Health Organization (WHO) provides health-related statistics for more than 1000 indicators for its 194 member states.
eMarketer
The library also subscribes to a few great resources that can help with finding consumer data to help you build your buyer persona.
eMarketer is the go-to authority on digital marketing, mobile, social media, and e-commerce, offering insights essential to navigating the changing, competitive and complex digital environment. By weighing and analyzing information from different sources, eMarketer provides information to evaluate emerging trends, validate decisions, develop new ways to reach consumers, and stay ahead of the competition. You can access eMarketer here.
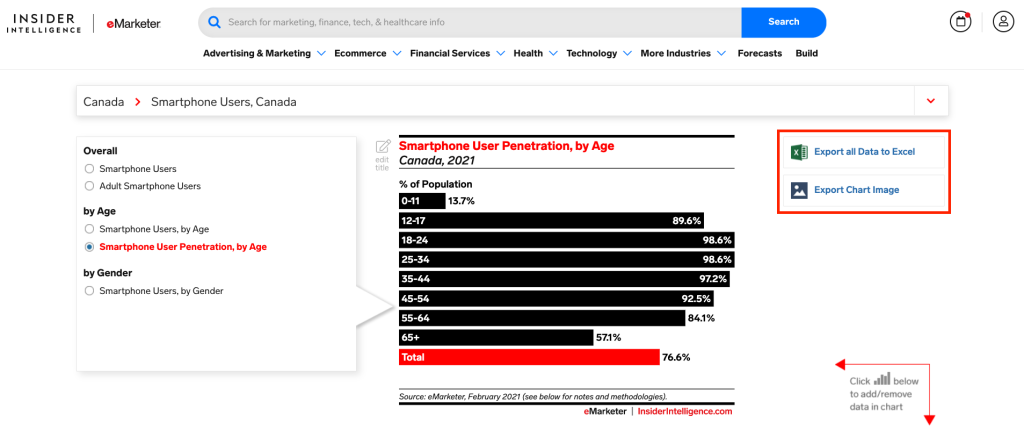
eMarketer has a helpful Forecast tool where you can view digital trends for multiple countries, including Canada. From the eMarketer homepage, navigate to Forecasts found in the menu headings across the top and shown in the screenshot below. You can change the country to Canada, select a topic on the left, and then view the various digital trends that are tracked within Canada.

Below is an example of Smartphone User Penetration, by Age, in Canada. You are able to export the data to Excel or export the chart as an image to use in a presentation or report. You can also use the filters on the left-hand side to manipulate the criteria presented in the chart.
Watch the video below to learn more about searching in eMarketer:
Statista
Statista is a statistics portal that provides business, marketing, demographic, and economic data on 80,000+ topics from over 18,000 sources. It covers a wide variety of topics and can be a great place to start with your research.
You can easily enter a keyword into the search field and Statista will suggest keywords for you to search. A quick search will provide you with individual charts or lengthy dossiers compiled on a specific topic. You can access Statista here.
Under the Report section on Statista, take a look at the Digital & Trend Reports or Politics & Society Reports to see what topics they cover related to your ideal customer.

In the Politics & Society Reports section, they cover topics such as eco-anxiety, immigration, vaccinations, crime, mental health, and more. Try filtering the results to only show reports from Canada.
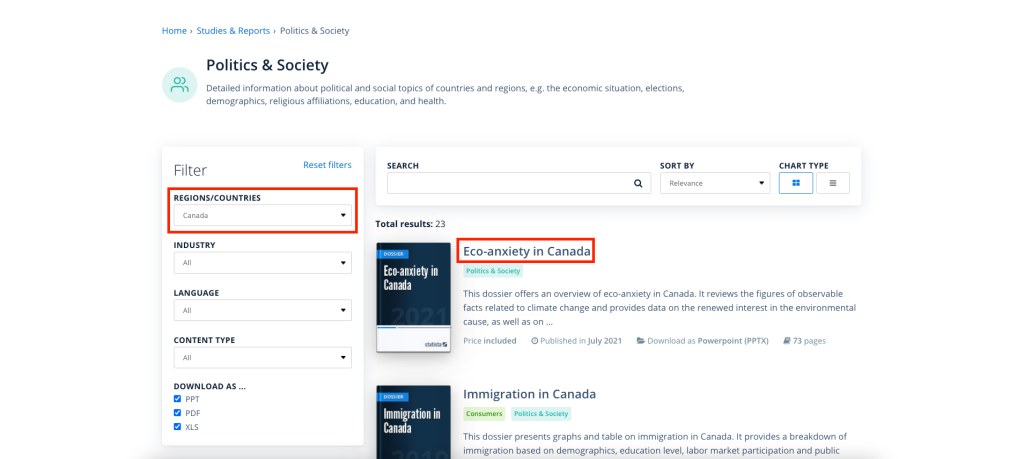
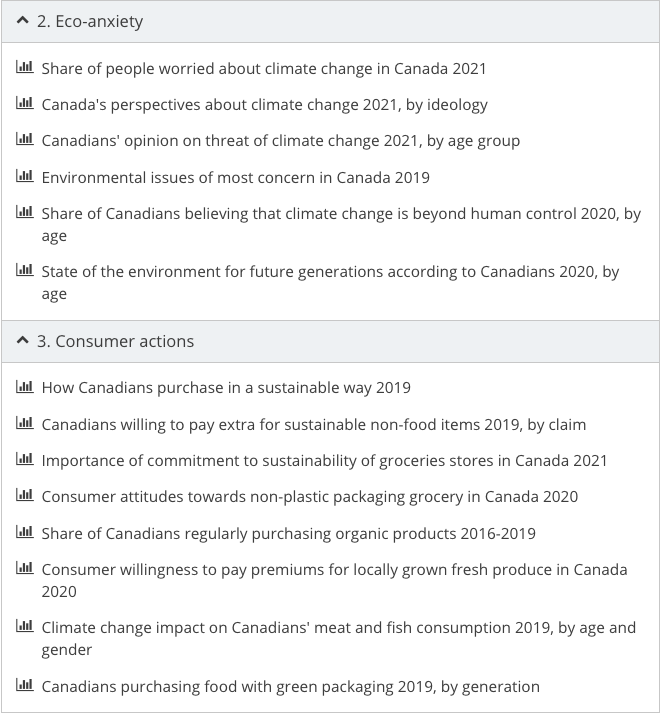
Below is an example of the kind of data points you can expect to find in a report looking at eco-anxiety in Canada. For someone developing a sustainable product, having an understanding of how Canadian’s view climate change, sustainability, and organic products can be helpful when deciding how to market your product or potential features to incorporate.
Watch the video below to learn more about searching in Statista:
Vividata
Vividata provides statistical data that tracks Canadian consumer demographics, media usage, lifestyle, attitudinal data, and brand/product usage across more than 150 categories. The data is derived from an annual national survey (Survey of the Canadian Consumer) of 40,000 Canadians aged 14 and over. You can access Vividata here.
You can learn about Canadian usage on topics related to:
-
Digital Devices
-
Types Canadians personally have
-
Brands Canadians personally have
-
How often Canadians use digital devices
-
-
Travel
-
Travel activities Canadians have done in the past year
-
Where Canadians intend to travel in the next year
-
How much Canadians intend to spend on their next trip
-
-
Personal Characteristics
-
Life events Canadians expect to happen in the next year
-
Statements on diet and health
-
Statements on the environment
-
Statements on the management of personal finances
-
Vividata can be difficult to navigate for first-time users so it’s suggested you follow along with the Vividata Tool Guide or contact the Business Librarian for help.
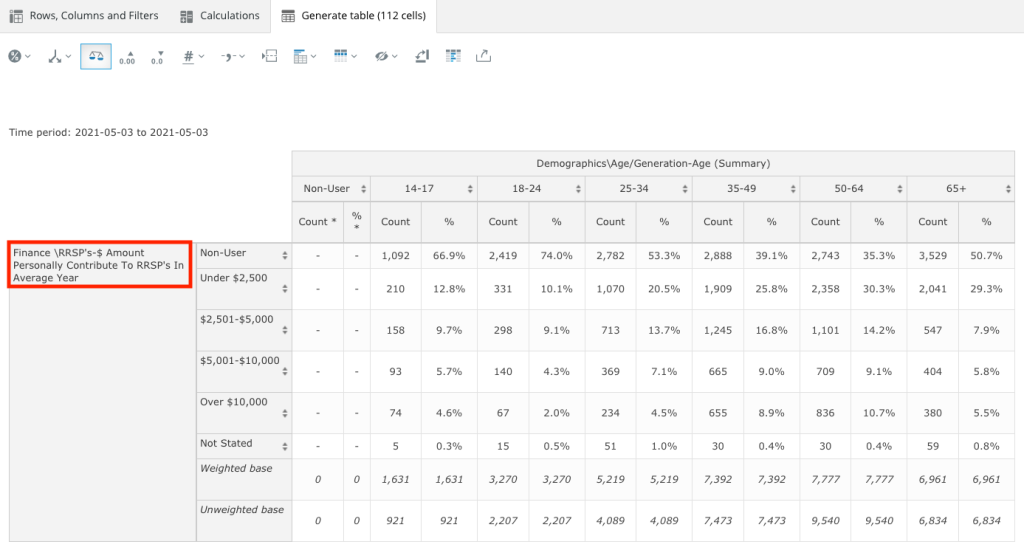
Below are a few examples of the types of charts and information you could expect to find in Vividata. This first chart breaks down the dollar amount that Canadians personally contribute to their RRSPs in an average year. In this example, I have chosen to view this data by age. See if you can find the percentage of 18-24 year-olds that on average contribute $2,501-$5,000 to their RRSP. The answer will be listed at the bottom of this page.
The chart below shows the types of leisure activities that Canadians personally participated in during the past month broken out by Gender. What is the percentage of Males that participate in Yoga/Pilates as compared to the percentage of Females? The answer will be listed at the bottom of this page.

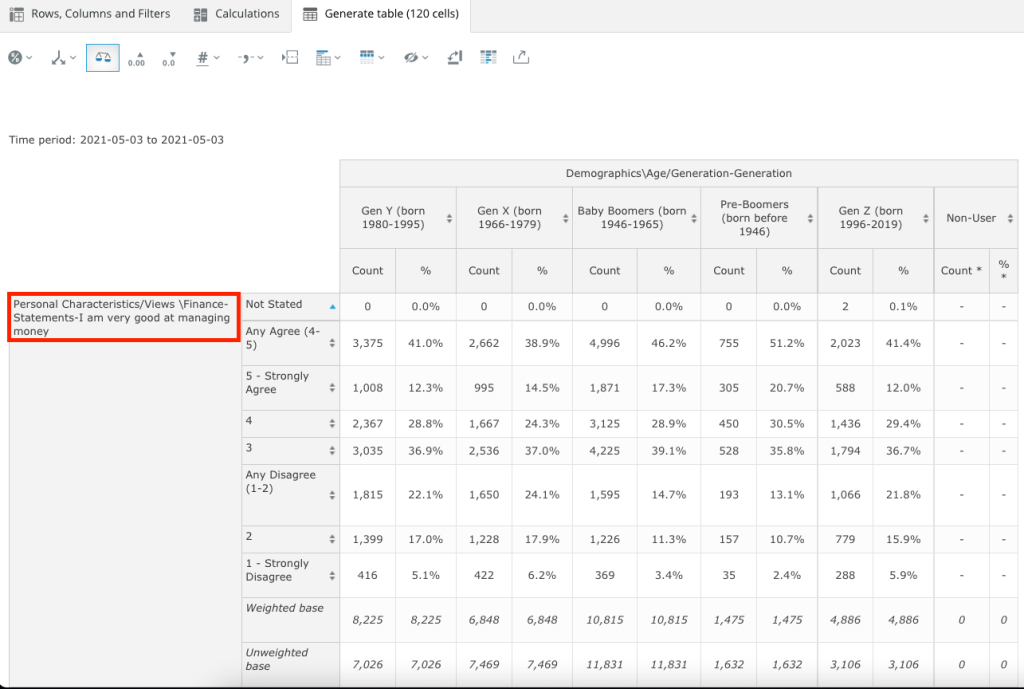
This final chart shows how strongly Canadians agree with the statement “I am very good at managing money” broken out by Generation. Based on the chart below, which Generation strongly disagrees the most with this statement? The answer will be listed at the bottom of this page.
Answers
1. 9.1%
2. Males 4.9% compared to Females 18.3%
3. 6.2% of Gen X respondents strongly disagreed with the statement
