1 Chapter 1: Demographic Trends
Tracy Everitt; Brittany Yantha; Megan Davies; and Joan Jory
Chapter 1 Learning Objectives
At the conclusion of this chapter, students will be able to:
Learning Objectives
- Explain the importance of studying the demographics of the population.
- Understand how the demographics of the aging population group have changed in recent years.
- Understand the difference between life span and life expectancy.
- Compare and contrast the global variance among demographic trends and identify how culture and environment can affect one’s aging experience and impact the aging process.
- Identify how culture and environment can affect one’s aging experience and impact the aging process
- Describe the age categories for older people (including centenarians)
Introduction
While the increased longevity and improved health at older ages seen in many parts of the world represent one of the crowning achievements of the 20th century, these trends also present significant challenges. Societal aging can affect economic growth, patterns of work and retirement, the way that families function, the ability of governments and communities to provide adequate resources for older adults, and the prevalence of chronic disease and disability. Understanding the aging population can give insights into health and nutrition patterns to complement active aging. This chapter focuses on the demographics of aging individuals and older adults.
1.1 What are Demographics?
Demographics are the characteristics of a population, such as age and gender, that have been categorized based on distinct criteria. This categorization is used to study the attributes of a particular group. Demographic data is essential for businesses, organizations, and governments to inform decision-making. Local, provincial, and federal governments can use demographic information to create public policies and allocate funds for public services. Population and health data can be used to determine adequate health service provision. Understanding the common concerns and health problems experienced by different age groups can ensure appropriate services are available to address the needs of the population.
1.2 Older Adults in Canada and the United States (US)
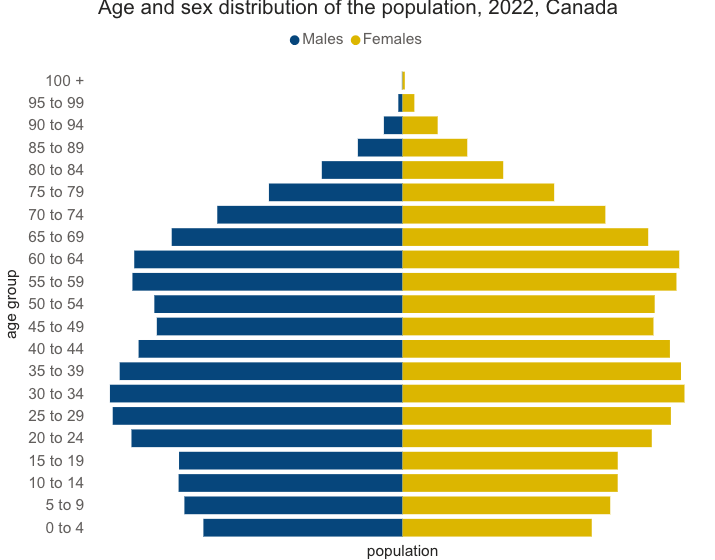
Figure 1.2.1: Demographic estimates of population distribution regarding age and sex in Canada in 2022.
Older adults comprise a larger portion of the population than in the past. According to the 2016 Canadian census, 16.9% of the population was 65 and older (Statistics Canada, 2017). Figure 1.2.1 shows the population distribution by age in Canada for the year 2022, which gives a visual representation. Older adults (50-65 years) now comprise a greater percentage of the population than children (0-19 years). For the first time in Canadian history, the percentage of Canadians 65 years and older in 2016 exceeded the number of children aged 14 and younger, and this trend is expected to continue (Statistics Canada, 2019).
After World War II, from 1946-1964, there was a temporary marked increase in the birth rate. The term “baby boomer” refers to a person born in this timeframe, and this generation makes up a large proportion of the population in North America. As people born in this period grow older and retire, the need for services and products to support this age group increases. The proportion of older people is expected to reach its peak in 2029, when the last cohort of the baby boomer generation reaches the age of 65 and older (Statistics Canada, 2019).
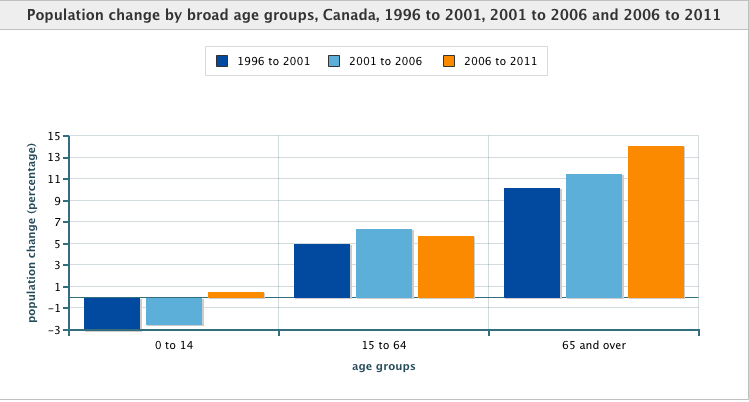
Figure 1.2.2 shows a visual representation of the change in the number of people by broad age groups in Canada over 5-year time periods. This figure provides a representation of the increasing proportion of older adults in Canada.
Demographics in the United States (U.S.) are undergoing similar trends. The U.S. population aged 65 and older is also growing rapidly. Between 2009 and 2019, the U.S. population over 65 grew by 34%, while the population group of 45-64 only grew by 4% during this time (2020 Profile of Older Americans, n.d.). In 2019, 16% of the U.S. population was 65 and older – expected to grow to 21.6% by 2040 (2020 Profile of Older Americans, n.d.). These shifts demonstrate the importance of collecting and studying demographic data to inform policy to ensure adequate services are available to support an aging population.
1.3 Globally a Larger Percentage of Us are Older
North American demographics reveal a shift toward a higher proportion of older adults making up the population. This phenomenon is occurring not only in Western countries such as Canada and the United States but can be seen across the globe. The National Institute on Aging states that there are 524 million people over 65 worldwide (NIA, 2015b). This number is expected to increase from 8% to 16% of the global population by 2050. Between 2010 and 2050, the number of older people in less developed countries is projected to increase by more than 250%, compared with only a 71% increase in developed countries. Declines in fertility rates and improvements in longevity account for the increasing number of those 65 years and older (NIA, 2015d).

Figure 1.3.1: Median age is increasing around the world.
Source: 085-OlderWoman © Trocaire is licensed under a CC BY (Attribution) license
The increased number of older people confers both challenges and opportunities. On one hand, there will be many people with advanced skills and knowledge ready to help build momentum for further innovation. On the other hand, there also will be a greater number of people needing assistance with age-associated illness and disability and relatively fewer family members to assist due to decreased fertility rates. Older people and family members will call on community resources and support which permit people of all ages to participate fully in society.
Demographic Impact of COVID-19 Pandemic in Canada
Data collected from the 2021 Canadian Census gives insight into the impacts of COVID-19. This pandemic has had significant direct and indirect health impacts on all Canadians but has disproportionately affected older adults. Government actions taken to mitigate the spread of COVID-19 had served in part to shield older adults from the virus. Figure 1.3.2 illustrates the disproportionate impacts of the COVID-19 pandemic on older people in Canada.
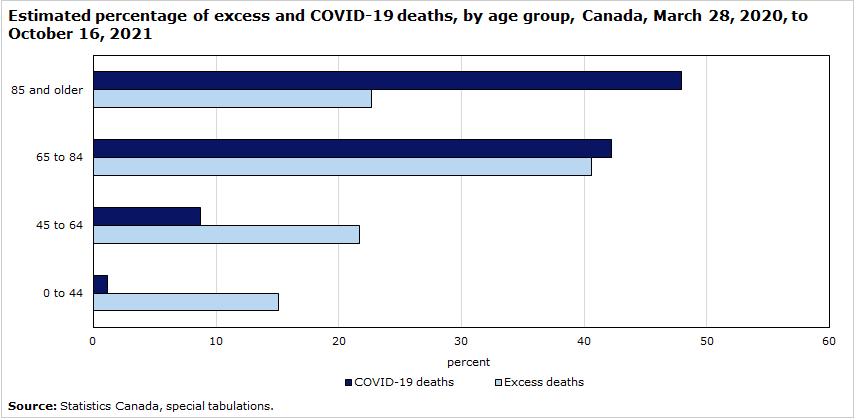 Figure 1.3.2: Estimated percentage of excess and COVID-19 deaths, by age group, in Canada from March 28, 2020, to October 16, 2021. Excess mortality, or excess deaths refers to additional mortality above the expected level based on mortality in the same period in the preceding year or averaged over several years.
COVID-19 is an illness caused by the severe acute respiratory syndrome coronavirus 2 (also known as SARS-CoV-2). COVID-19 spreads through airborne droplets when people are in close contact since a person’s breath can be infected with the virus (Mayo Clinic, 2024). It has been labelled as a pandemic, with symptoms ranging from mild to severe, including dry cough, shortness of breath, fatigue, headaches, muscle aches, and fever. Severity can progress through four stages: mild, moderate, severe, and critical. In each case lung and respiratory system functions are increasingly affected, where the lungs do not work properly in severe cases and fail in critical cases (Mayo Clinic, 2024). COVID-19 can lead to other health complications like pneumonia, respiratory distress syndrome, inflammatory response, and kidney injuries. COVID-19 disrupted the lives of millions of people, so it is important to address what the population can do to manage and recover from it.
Vaccine development has helped decrease cases, enabling a return to everyday life. Yet, reinfection remains a risk due to fading immunity and viral mutations. The virus can evolve, potentially getting past previous vaccinations. “Post-COVID-19 Syndrome” cases have been reported, with lingering symptoms for months, prompting ongoing research into long-term effects. Therefore, continuous learning about symptom management is crucial to prepare for future outbreaks and continual symptoms (Mayo Clinic, 2024).
Older adults, particularly those aged 65 and above, face a higher risk of getting COVID-19 and severe symptoms leading to hospitalization (Mayo Clinic; Naja & Hamadeh, 2020). The 2021 Canadian Census highlighted the disproportionate impact of COVID-19 on older adults, with those aged 85 and above having the highest percentage of COVID-19 deaths at 47.9%. Therefore, targeted information about COVID-19 should prioritize this demographic. Specific groups of people at a higher risk for contracting COVID-19 are those with preexisting chronic illness and comorbidities such as cancer, diabetes, Alzheimer’s, a weakened immune system, and heart, kidney, liver, and lung diseases, which contribute to increased susceptibility to severe COVID-19 and its long-term effects (Mayo Clinic, 2024).
Measures of social distancing and isolation were important to decrease rates of disease, but they had repercussions on food access and utilization. While the lockdown is no longer in effect, people’s habits were altered (Naja & Hamadeh, 2020). Additionally, people still need to isolate when they have COVID-19 and are contagious, which can create lower physical activity levels and irregular eating patterns, negatively affecting mental health. Stress and emotional eating are often experienced while infected with COVID-19, which are both associated with unhealthy dietary patterns, such as increased saturated fatty acid consumption (Antwi et al., 2021; Naja & Hamadeh, 2020; Butler & Barrientos, 2020). Some nutrition-related side effects that can last long after COVID-19 include an upset stomach, vomiting, diarrhea, and a loss of taste or smell. The exact cause of the loss in taste and smell (known as ageusia and anosmia) has not been identified and further research in this area needs to be conducted (Antwi et al., 2021). Changes in smell and taste can reduce the enjoyment of food, decrease appetite, and cause a loss of interest in food or a craving for high sodium and sugar content to be able to taste food (Antwi et al., 2021). This could further result in a higher risk of malnutrition.
For adults over 65, or those with chronic conditions, early symptom reporting to a healthcare provider for tailored management of COVID-19 is crucial (Mayo Clinic, 2024). There are currently no specific diagnostic tests or treatments available for the long-term effects of COVID-19 (Government of Canada, 2023). However, vaccination post-infection is advised as it can enhance immunity, reduce the risk of reinfection, and decrease the severity of symptoms (Mayo Clinic, 2024). Non-nutrition-related side effects such as fatigue can be managed by breaking physical activity into smaller sessions and prioritizing rest. Deep breathing exercises and stress reduction techniques help alleviate shortness of breath (British Heart Foundation, 2023). Brain fog can be addressed by minimizing distractions, moderating alcohol intake, ensuring adequate sleep, and engaging in stimulating activities like socializing. Muscle pains can be managed with stretching, yoga, and gentle strength exercises; over-the-counter pain relief can be recommended by a pharmacist if needed (British Heart Foundation, 2023). It is also advised to maintain adequate exercise and regular sleep to boost mental health (Naja & Hamadeh, 2020).
1.4 Life Expectancy vs. Life Span
Lifespan or Maximum Lifespan is the greatest age reached by a member of any population (or species). For humans, the lifespan is currently between 120 and 125. Life Expectancy is defined as the average number of years that members of a population (or species) live. According to the World Health Organization (WHO, 2016) global life expectancy at birth in 2015 was 71.4 years, with females reaching 73.8 years and males reaching 69.1 years. Women live longer than men worldwide, and the gap between the sexes has remained the same since 1990. Overall life expectancy ranged from 60.0 years in the WHO African Region to 76.8 years in the WHO European Region. Global life expectancy increased by 5 years between 2000 and 2015, and the largest increase was in the WHO African Region where life expectancy increased by 9.4 years. This was due primarily to improvements in child survival and access to antiretroviral medication for the treatment of HIV. According to the World Health Organization (WHO), in 2019, life expectancy for both sexes in Canada was 82 years – 80 for males and 84 for females. Figure 1.4.1 describes life expectancy around the world.
World Healthy Life Expectancy
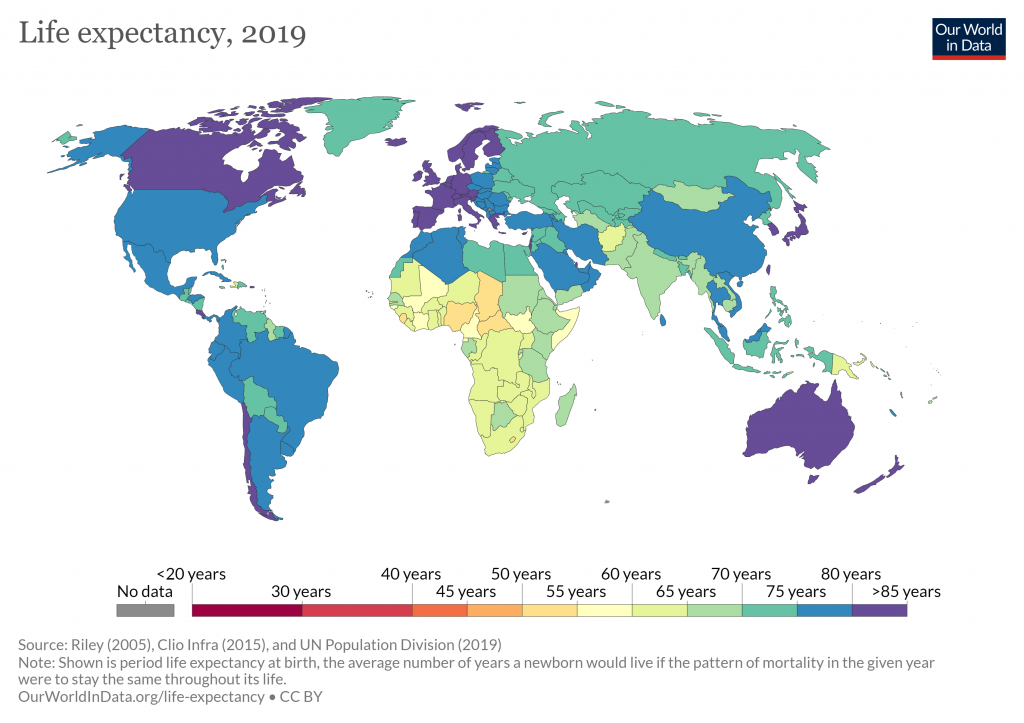
Figure 1.4.1: Life expectancy around the world.
Source: https://ourworldindata.org/grapher/life-expectancy
A better way to appreciate the diversity of experiences is to go beyond chronological age and examine how well the person is aging. Many older people enjoy good health, social satisfaction, and overall well-being, representing optimal aging, while others of similar age experience poor health and increased dependency on others. When looking at large populations, the WHO (2016) measures how many equivalent years of full health a newborn is expected to have on average. This age considers current age-specific mortality, morbidity, and disability risks and is called Healthy Life Expectancy. In 2015, the global Healthy Life Expectancy was 63.1 years, up from 58.5 years in 2000. The WHO African Region had the lowest Healthy Life Expectancy at 52.3 years, while the WHO Western Pacific Region had the highest at 68.7 years. In Canada in 2019, the Healthy Life Expectancy for males was 70.5 and 72 years for females.
Clicking on the following link will bring you to an interactive map depicting life expectancy around the world. Click on countries of interest to see changes in life expectancy over time: https://ourworldindata.org/grapher/life-expectancy?tab=map
Life Expectancy Changes
The Organization for Economic Co-operation and Development, the OECD, is an international organization that works to shape policies that foster better lives (OECD, n.d.). The goal is to combine the efforts of governments, policymakers, and people across the globe to work on establishing evidence-based international standards and finding solutions to a range of social, economic, and environmental issues (OECD, n.d.). The OECD (2017) has researched the specific factors influencing life expectancies.
Striking differences in life expectancy have been observed across and within different OECD nations. This reveals how powerfully societies and their existing cultures shape the life experiences of their citizens at any age. These statistics tell us more about the differences in societal impact rather than genetic or biological influences. The OECD reported that efforts towards increased health spending per capita, a minimum sufficient income per capita, primary education, and a healthy lifestyle will positively contribute to the longevity of the lives of its citizens.
There are two concerns about an aging population. First, the larger proportion of older people to young people will create a burden on the economy, and second, longevity for more elderly people may increase activity limitations and disability. The goal is to improve life quality and longevity so older adults can be independent longer, limiting illness and disability. This goal is called compressed morbidity or healthy life expectancy. There is mixed evidence of modest increased healthy life expectancy and longer life in Canada and the U.S. (Bushnik, Tjepkema, & Martel, 2018), especially for males. Across the world, such changes so far have not resulted in equally compressed morbidity.
In the Blue Zones shown on the map above of longevity around the world, people not only live longer, but they live longer with good quality of life (Buettner & Skemp, 2017).
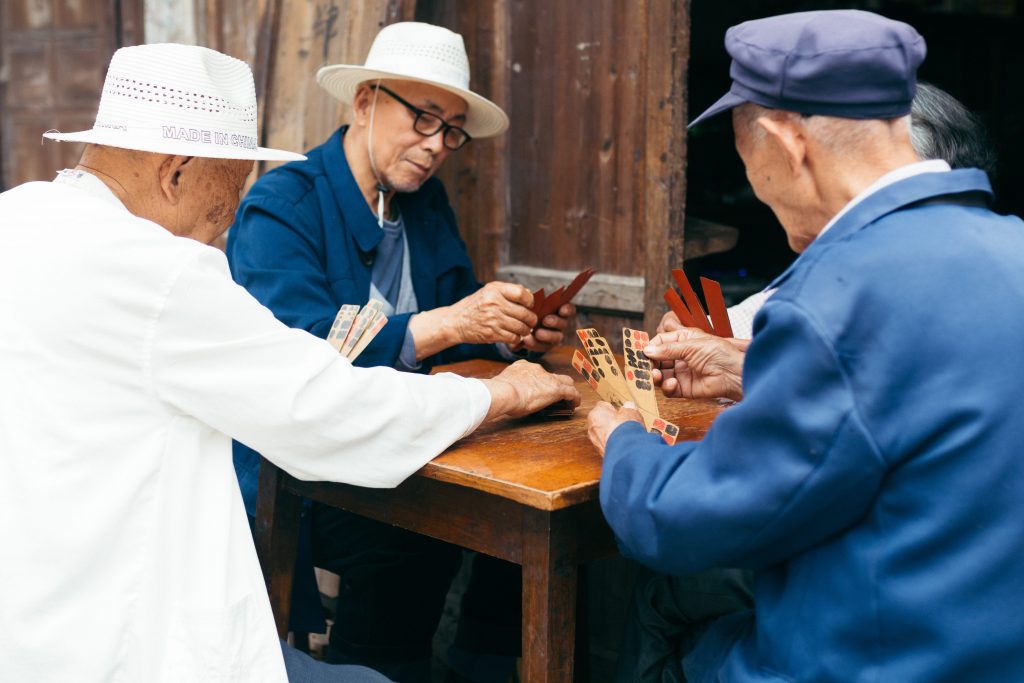
Source: 99-OlderAsianMen(httpswww.piqsels.comenpublic-domain-photo-otiox) is licensed under a CC0 (Creative Commons Zero) license
1.5 Gender Differences in Life Expectancy
Worldwide, there are recorded gender gaps in life expectancy as women on average are more likely to live a longer life than men. These small differences in life expectancies can be attributed to biological characteristics of the male and female sexes as well as varied lifestyles and environments that influence behaviour patterns throughout one’s day-to-day life.
Biological Explanations
Biological differences in sex chromosomes and a different pattern of gene expression is theorized as one reason why females have a longer life expectancy than males (Chmielewski, Boryslawski, & Strzelec, 2016). Males are heterogametic (XY), whereas females are homogametic (XX) with respect to the sex chromosomes. Males can only express their X chromosome genes that come from the mother, while females have an advantage by selecting the “better” X chromosome from their mother or father, while inactivating the “worse” X chromosome. This process of selection for “better” genes is impossible in males and results in the greater genetic and developmental stability of females.
Due to the inability to select the ‘better’ of the two X chromosomes, men are more likely to contract viral and bacterial infections, and their immunity at the cellular level decreases significantly faster with age. Although women are slightly more prone to autoimmune and inflammatory diseases, such as rheumatoid arthritis, the gradual deterioration of the immune system is slower in women (Caruso, Accardi, Virruso, & Candore, 2013; Hirokawa et al., 2013).
Looking at the influence of hormones, estrogen levels in women appear to have a protective effect on their heart and circulatory systems (Viña, Borrás, Gambini, Sastre, & Pallardó, 2005). Estrogen also has antioxidant properties that protect against harmful effects of free radicals, which damage cell components, cause mutations, and are in part responsible for the aging process. Testosterone levels are higher in men than in women and are related to more frequent cardiovascular and immune disorders. The level of testosterone is also responsible, in part, for male behavioural patterns, including increased level of aggression and violence (Martin, Poon, & Hagberg, 2011; Borysławski & Chmielewski, 2012).
Lifestyle Factors
Not all the reasons women live longer than men are biological. As previously mentioned, male behavioural patterns and lifestyle play a significant role in the shorter lifespans for males. One significant factor is that males work in more dangerous jobs, including police, firefighters, and construction, and are more exposed to violence. According to the Federal Bureau of Investigation (2014) there were 11,961 homicides in the U.S. in 2014, and of those, 77% were males. Males are more than three times more likely to commit suicide (CDC, 2016a). Further, males serve in the military in much larger numbers than females. According to the Department of Defense (2015), in 2014, 83% of all Services (Navy, Army, Marine Corps and Air Force) officers were male, while 85% of all enlisted service members were male.
Other lifestyle factors can make older adults more at risk for health and nutrition issues, shortening their life expectancy. Older adults often experience a lack of motivation to cook for themselves. This could be because they may be cooking for one, have limited appetite, or lack mobility. People in this population group can experience a lack of access to adequate nutrition and resources that aid in their overall health. Some lack knowledge of their nutrient needs or how these change due to aging and changing body composition. Older adults often take multiple medications, which can cause interactions with each other or with certain nutrients compromising nutrient absorption- a potential cause of malnutrition in older adults. Some older adults are unable to consume certain food textures, making it difficult to get all necessary nutrients for the day. Overall, most older people experience feeling less hungry; however, not being hungry is not the same as being nourished, and these adults may experience malnutrition as a result.
LGBTQ+ Communities
The LGBTQ+ communities in Canada experience numerous health inequities that affect their life expectancy. Health inequities are experienced differently by each of the LGBTQIA2 communities, but in general, people in these communities are more likely than heterosexual Canadians to develop mental health disorders, have suicidal thoughts and attempt suicide. Social factors such as the long-time stigmatization of gender and sexual diversity can render these individuals vulnerable and invisible. The stress associated with discrimination is directly linked to psychological distress and higher suicide risk among members of the LGBTQ+ community (Casey, 2019). Older adults who identify with the LGBTQ+ community are more likely to live alone than heterosexual people of the same age, potentially contributing to a lack of social support and isolation. There are also concerns about lower quality health care due to sexual orientation or gender identity (Casey, 2019). Sexual and gender minorities often need to educate health professionals about their risk factors and health needs, adding an extra burden. Ways to promote health equity for LGBTQ+ communities include providing opportunities for social connections in LGBTQ+ safe public spaces and improving health provider sexual diversity training at all levels – including administrative staff, care attendants, nurses, physicians, psychologists, dietitians, and social workers (Casey, 2019).
To obtain more information about the current health inequities affecting these communities as well as ways in which the inequities can be reduced see The Standing Committee of Health developed a report at: https://www.ourcommons.ca/Content/Committee/421/HESA/Reports/RP10574595/hesarp28/hesarp28-e.pdf
1.6 Age Categories for Older People
There have been many ways to categorize older people. For example, age may be divided into categories: young–old (65-84), oldest-old (85-99), and centenarians (100+). These categories are based on aging conceptions, including biological, psychological, social, and chronological differences.
Young-old
The age range of 65-84 may be classified as the young-old category (Ortman et al., 2014). According to Barnes (2011a), this age category spans the post-employment years for many people until approximately 80-85 years, when age-related limitations typically begin to occur for current and recent cohorts in physical, emotional, and cognitive development. Generally, this age span includes many positive aspects and is considered the “golden years“ of adulthood. Why so positive? Individuals at this age often have fewer responsibilities than in previous stages, and when combined with adequate finances and good health, they can pursue leisure and self-fulfillment opportunities. It is also an unusual age in that people are considered both old and not old in age (Rubinstein, 2002).
When compared to those above 85, the young-old experience relatively good health and social engagement (Smith, 2000), knowledge and expertise (Singer, Verhaeghen, Ghisletta, Lindenberger, & Baltes, 2003), and adaptive flexibility in daily living (Riediger, Freund, & Baltes, 2005). The young-old also show strong performance in attention, memory, and crystallized intelligence. In fact, those identified as young-old are more like those in midlife than those who are 85 and older. This group is less likely to require long-term care, to be dependent or poor, and more likely to be married, working for pleasure rather than income, and living independently. Chronic diseases, such as cardiovascular disease, hypertension, and cancer, are most common (especially later in this period), but because they are linked to lifestyle choices, they typically can be prevented, lessened, or managed (Barnes, 2011b). Overall, those in this age period feel a sense of happiness and emotional well–being that is better than at any other period of adulthood (Carstensen, Fung, & Charles, 2003; George, 2009; Robins & Trzesniewski, 2005).
Oldest-old
Most research done with older adults tends to focus on young-old individuals, whereas efforts to study the dimensions of advanced age are less frequent. This older age group often includes people who have more serious chronic ailments among the older adult population. In the U.S., the oldest-old represented 14% of the older adult population in 2015 (He, Goodkind, & Kowal, 2016). This age group is one of the fastest growing worldwide and is projected to increase more than 300% over current levels (NIA, 2015b). The oldest-old are likely to be nearly 18 million by 2050, or about 4.5% of the U. S. population, compared to less than 2% of the population today. Females comprise more than 60% of those 85 and older but also suffer from more chronic illnesses and disabilities than older males (Gatz et al., 2016).
Those 85 and older are more likely to require long-term care and to be in nursing homes than the youngest-old. In Canada, Ontario‘s long-term care homes provide care and support to more than 115,000 people and their families every year. Long-term care homes provide 24/7 nursing care and supervision, primary medical care, help with daily activities and interests, and a safe, caring environment. Most people who live in long-term care have some form of cognitive impairment and physical frailty, along with chronic health conditions that have seriously compromised their health. As part of the health care system, long-term care homes are licensed and funded by the Ministry of Health and Long-Term Care to provide care for people who need support beyond what is possible at home.
In the U.S., almost 50% of the oldest-old require some assistance with daily living activities (APA, 2016). However, most still live in the community rather than a nursing home, as shown in Figure 1.6.2 (Stepler, 2016b). The oldest-old are less likely to be married and live with a spouse compared with most young-old (APA, 2016; Stepler, 2016c). Gender is also an important factor in the likelihood of being married or living with one‘s spouse.
Centenarians

Figure 1.6.1: Jean Louise Calment, from France, was recorded to live over 122 years (deceased 1997).
Source: 089-JeanneLouiseCalment122yo is licensed under an All Rights Reserved license
A segment of the oldest-old are centenarians, 100 and older; some are also called supercentenarians, 110 and older (Wilcox, Wilcox & Ferrucci, 2008). In 2015 there were nearly half a million centenarians worldwide, and it is estimated that this age group will grow to almost 3.7 million by 2050. The number of Canadians living to 100 and beyond reached a record high in 2021. Some centenarians say getting there is all about keeping your hands busy, having a loving family, and enjoying life‘s small pleasures. Canadians are living much longer now thanks to improved drug therapies, vaccines, and a more active lifestyle.
The U. S. has the most centenarians, but Japan and Italy have the most per capita (Stepler, 2016e). Most centenarians tended to be healthier than many of their peers as they grew older, and often there was a delay in the onset of any serious disease or disability until their 90s. Additionally, 25% reached 100 with no serious chronic illnesses like depression, osteoporosis, heart disease, respiratory illness, or dementia (Ash et al. 2015). Centenarians are more likely to experience a rapid terminal decline in later life, meaning that for most of their adulthood and even older adult years, they are relatively healthy compared to many other older adults (Ash et al., 2015; Wilcox et al., 2008). According to Guinness World Records (2016), Jeanne Louise Calment has been documented to be the longest living person at 122 years and 164 days old.
This chapter has been adapted from ‘Always Developing’ by Anne Baird: https://ecampusontario.pressbooks.pub/alwaysdeveloping/
Creative Commons Attribution: BY NC SA
References
Antwi, J., Appiah, B., Oluwakuse, B., & Abu, B. A. (2021, November 27). The nutrition-covid-19 interplay: A Review. Current Nutrition Reports, 10(4), 364–374. https://doi.org/10.1007/s13668-021-00380-2
Ash, A. S., Kroll-Desroisers, A. R., Hoaglin, D. C., Christensen, K., Fang, H., & Perls, T. T. (2015). Are members of long-lived families healthier than their equally long-lived peers? Evidence from the long-life family study. Journal of Gerontology: Series A: Biological Sciences and Medical Sciences. Advance online publication. doi:10.1093/gerona/glv015
Barnes, S. F. (2011a). Fourth age-the final years of adulthood. San Diego State University Interwork Institute. http://calbooming.sdsu.edu/documents/TheFourthAge.pdf
Barnes, S.F. (2011b). Third age-the golden years of adulthood. San Diego State University Interwork Institute. http://calbooming.sdsu.edu/documents/TheThirdAge.pdf
British Heart Foundation. (2023, February 20). Long COVID recovery guide: Tips for fatigue and breathlessness. BHF. https://www.bhf.org.uk/informationsupport/heart-matters-magazine/news/coronavirus-and-your-health/long-covid-recovery
Bushnik, T., Tjepkema, M., & Martel, L. (2018). Health-adjusted life expectancy in Canada. Health Reports, 29(4), 14-22.
Butler, M. J., & Barrientos, R. M. (2020, April 18). The impact of nutrition on COVID-19 susceptibility and long-term consequences. Brain, Behavior, and Immunity, 87, 53–54. https://doi.org/10.1016/j.bbi.2020.04.040
Canada, P. H. A. (2023, March 9). Government of Canada. Post-COVID-19 condition (long COVID) – Canada.ca. https://www.canada.ca/en/public-health/services/diseases/2019-novel-coronavirus-infection/symptoms/post-covid-19-condition.html
Caruso, C., Accardi, G., Virruso, C., & Candore, G. (2013). Sex, gender and immunosenescence: A key to understand the different lifespan between men and women? Immunity & Ageing, 10, 20.
Carstenson, L. L., Fung, H. H., & Charles, S. T. (2003). Socioemotional selectivity theory and the regulation of emotion in the second half of life. Motivation and Emotion, 27, 103-123.
Casey, B. (2019). The health of LGBTQIA2 communities in Canada. House of Commons of Canada, 42-1.
Centers for Disease Control and Prevention. (2016a). Increase in Suicide in the United States, 1999–2014. http://www.cdc.gov/nchs/products/databriefs/db241.htm
Centers for Disease Control and Prevention. (2016b). Older Persons’ Health. http://www.cdc.gov/nchs/fastats/older-american-health.htm
Chmielewski, P., Boryslawski, K., & Strzelec, B. (2016). Contemporary views on human aging and longevity. Anthropological Review, 79(2), 115-142.
Department of Defense. (2015). Defense advisory committee on women in the services. http://dacowits.defense.gov/Portals/48/Documents/Reports/2015/Annual%20Report/2015%20DACOWITS%20Annual%20Report_Final.pdf
Federal Bureau of Investigation. (2014). Crime in the United States. https://ucr.fbi.gov/crime-in-the-u.s.-2014/tables/expanded-homicide-data/expanded_homicide_data_table_1_murder_victims_by_race_ethnicity_and_sex_2014.xls
Gatz, M., Smyer, M. A., & DiGilio, D. A. (2016). Psychology’s contribution to the well-being of older Americans. American Psychologist, 71(4), 257-267.
George, L.K. (2009). Still happy after all these years: research frontiers on subjective well-being in later life. Journal of Gerontology: Social Sciences, 65B (3), 331–339. doi:10.1093/geronb/gbq006
Guinness World Records. (2016). Oldest person (ever). http://www.guinessworldrecords.com/search?term=oldest+person+%28%ever%29
He, W., Goodkind, D., & Kowal, P. (2016). An aging world: 2015. International Population Reports. U.S. Census Bureau.
Laslett, P. (1989). A fresh map of life: The emergence of the third age. London, UK: Weidenfeld & Nicolson.
Martin, P., Poon, L.W., & Hagberg, B. (2011). Behavioral factors of longevity. Journal of Aging Research, 2011/2012, 1–207.
Mayo Foundation for Medical Education and Research. (2024, February 21). Coronavirus disease 2019 (covid-19). Mayo Clinic. https://www.mayoclinic.org/diseases-conditions/coronavirus/symptoms-causes/syc-20479963
Miller, E. A. (2020). Protecting and improving the lives of older adults in the COVID-19 era. Journal of aging & social policy, 32(4-5), 297-309.
Naja, F., & Hamadeh, R. (2020). Nutrition amid the COVID-19 pandemic: A multi-level Framework for Action. European Journal of Clinical Nutrition, 74(8), 1117–1121. https://doi.org/10.1038/s41430-020-0634-3
National Institute on Aging. (2015b). Global Health and Aging. http://www.nia.nih.gov/reserach/publication/global-health-and-aging/living/longer
National Institute on Aging. (2015d). Humanity’s aging. https://www.nia.nih.gov/research/publication/global- health-and-aging/humanity’s-aging
OECD. (n.d.). OECD-Who we are. https://www.oecd.org/about/
OECD. (2017). Health at a glance 2017: OECD Indicators. Paris: OECD Publishing. http://dx.doi.org/10.1787/health_glance-2017-en.
Ortman, J. M., Velkoff, V. A., & Hogan, H. (2014). An aging nation: The older population in the United States. United States Census. http://www.census.gov/prod/2014pubs/p25-1140.pdf
Robins, R.W., & Trzesniewski, K.H. (2005). Self-esteem development across the lifespan. Current Directions in Psychological Science, 14 (3), 158-162. DOI: 10.1111/j.0963- 7214.2005.00353x
Rubinstein, R.L. (2002). The third age. In R.S. Weiss & S.A. Bass (Eds.), Challenges of the third age; Meaning and purpose in later life (pp. 29-40). New York: Oxford University Press.
Shmerling, R. H. (2016). Why men often die earlier than women. Harvard Health Publications. http://www.health.harvard.edu/blog/why-men-often-die-earlier-than-women-201602199137
Singer, T., Verhaeghen, P., Ghisletta, P., Lindenberger, U., & Baltes, P.B. (2003). The fate of cognition in very old age: Si x-year longitudinal findings in the Berlin Aging Study (BASE). Psychology and Aging, 18, 318-331.
Smith, J. (2000). The fourth age: A period of psychological mortality? Max Planck Forum, 4, 75-88. Social Security Administration. (2016). Retirement planner: Benefits by year of birth. https://www.ssa.gov/planners/retire/agereduction.html
Statistics Canada. (2017, May 3). Age and Sex Highlight Tables, 2016 Census—Population by broad age groups and sex, Canada and economic regions. https://www12.statcan.gc.ca/census-recensement/2016/dp-pd/hlt-fst/as/Table.cfm?Lang=E&T=11
Statistics Canada. (2019). Canada’s population estimates: Age and sex, July 1, 2018. Statistics Canada https://www150.statcan.gc.ca/n1/daily-quotidien/190125/dq190125a-eng.htm
Statistics Canada. (2019, August 14). Population Projections for Canada (2018 to 2068), Provinces and Territories (2018 to 2043). https://www150.statcan.gc.ca/n1/pub/91-520-x2019001-eng.htm
Statistics Canada. 2022. (table). Census Profile. 2021 Census of Population. Statistics Canada Catalogue no. 98-316-X2021001. Ottawa. Released July 13, 2022.
https://www12.statcan.gc.ca/census-recensement/2021/dp-pd/prof/index.cfm?Lang=E (accessed August 4, 2022).
Statistics Canada (2022, March 10). Changes in Canadian Population Expectations Post-COVID. Government of Canada, Statistics Canada. https://www150.statcan.gc.ca/n1/pub/11-631-x/11-631-x2022001-eng.htm
Viña, J., Borrás, C., Gambini, J., Sastre, J., Pallardó, F.V. (2005). Why females live longer than males: Control of longevit y by sex hormones. Science of Aging Knowledge Environment, 23, 17.
Wilcox, B. J. Wilcox, D. C., & Ferrucci, L. (2008). Secrets of healthy aging and longevity from exceptional survivors around the globe: Lessons from octogenarians to supercentenarians. Journal of Gerontology, 63 (11), 1181-1185.
2020 Profile of Older Americans. (n.d.). 21. https://acl.gov/sites/default/files/Aging%20and%20Disability%20in%20America/2020ProfileOlderAmericans.Final.pdf
https://www.statcan.gc.ca/en/subjects-start/older_adults_and_population_aging
Media Attributions
- Screen Shot 2022-12-20 at 9.28.17 AM
- Screen Shot 2022-12-20 at 9.28.54 AM
- 085-OlderWoman © Trocaire is licensed under a CC BY (Attribution) license
- Screen Shot 2022-12-20 at 9.29.16 AM
- 086-LifeExpectancyWorldwide
- 99-OlderAsianMen(httpswww.piqsels.comenpublic-domain-photo-otiox) is licensed under a CC0 (Creative Commons Zero) license
- 089-JeanneLouiseCalment122yo is licensed under a All Rights Reserved license
