Approaches to Research Design
Learning Objectives
By the end of this section, you will be able to:
- Describe the different research methods used by psychologists
- Discuss the strengths and weaknesses of case studies, naturalistic observation, surveys, and archival research
- Compare longitudinal and cross-sectional approaches to research
- Compare and contrast correlation and causation
TRICKY TOPIC: INTRODUCTION TO RESEARCH
If the video above does not load, click here: https://www.youtube.com/watch?v=TQl8jynMbGU&feature=youtu.be
For a full transcript of this video, click here
There are many research methods available to psychologists in their efforts to understand, describe, and explain behaviour and the cognitive and biological processes that underlie it. Some methods rely on observational techniques. Other approaches involve interactions between the researcher and the individuals who are being studied—ranging from a series of simple questions to extensive, in-depth interviews—to well-controlled experiments.
Each of these research methods has unique strengths and weaknesses, and each method may only be appropriate for certain types of research questions. For example, studies that rely primarily on observation produce incredible amounts of information, but the ability to apply this information to the larger population is somewhat limited because of small sample sizes. Survey research, on the other hand, allows researchers to easily collect data from relatively large samples. While this allows for results to be generalized to the larger population more easily, the information that can be collected on any given survey is somewhat limited and subject to problems associated with any type of self-reported data. Some researchers conduct archival research by using existing records. While this can be a fairly inexpensive way to collect data that can provide insight into a number of research questions, researchers using this approach have no control on how or what kind of data was collected. All of the methods described thus far are correlational in nature. This means that researchers can speak to important relationships that might exist between two or more variables of interest. However, correlational data cannot be used to make claims about cause-and-effect relationships.
Correlational research can find a relationship between two variables, but the only way a researcher can claim that the relationship between the variables is cause and effect is to perform an experiment. In experimental research, which will be discussed later in this chapter, there is a tremendous amount of control over variables of interest. While this is a powerful approach, experiments are often conducted in very artificial settings. This calls into question the validity of experimental findings with regard to how they would apply in real-world settings. In addition, many of the questions that psychologists would like to answer cannot be pursued through experimental research because of ethical concerns.
If the video above does not load, click here: https://www.youtube.com/watch?v=Od7bF_uJewY&feature=youtu.be
For a full transcript of this video, click here
Clinical or Case Studies
In 2011, the New York Times published a feature story on Krista and Tatiana Hogan, Canadian twins. These particular twins are unique because Krista and Tatiana are conjoined twins, connected at the head. There is evidence that the two girls are connected in a part of the brain called the thalamus, which is a major sensory relay centre. Most incoming sensory information is sent through the thalamus before reaching higher regions of the cerebral cortex for processing.
The implications of this potential connection mean that it might be possible for one twin to experience the sensations of the other twin. For instance, if Krista is watching a particularly funny television program, Tatiana might smile or laugh even if she is not watching the program. This particular possibility has piqued the interest of many neuroscientists who seek to understand how the brain uses sensory information.
These twins represent an enormous resource in the study of the brain, and since their condition is very rare, it is likely that as long as their family agrees, scientists will follow these girls very closely throughout their lives to gain as much information as possible (Dominus, 2011).
Over time, it has become clear that while Krista and Tatiana share some sensory experiences and motor control, they remain two distinct individuals, which provides tremendous insight into researchers interested in the mind and the brain (Egnor, 2017).
In observational research, scientists are conducting a clinical or case study when they focus on one person or just a few individuals. Indeed, some scientists spend their entire careers studying just 10–20 individuals. Why would they do this? Obviously, when they focus their attention on a very small number of people, they can gain a tremendous amount of insight into those cases. The richness of information that is collected in clinical or case studies is unmatched by any other single research method. This allows the researcher to have a very deep understanding of the individuals and the particular phenomenon being studied.
If clinical or case studies provide so much information, why are they not more frequent among researchers? As it turns out, the major benefit of this particular approach is also a weakness. As mentioned earlier, this approach is often used when studying individuals who are interesting to researchers because they have a rare characteristic. Therefore, the individuals who serve as the focus of case studies are not like most other people. If scientists ultimately want to explain all behaviour, focusing attention on such a special group of people can make it difficult to generalize any observations to the larger population as a whole. Generalizing refers to the ability to apply the findings of a particular research project to larger segments of society. Again, case studies provide enormous amounts of information, but since the cases are so specific, the potential to apply what’s learned to the average person may be very limited.
Naturalistic Observation
If you want to understand how behaviour occurs, one of the best ways to gain information is to simply observe the behaviour in its natural context. However, people might change their behaviour in unexpected ways if they know they are being observed. How do researchers obtain accurate information when people tend to hide their natural behaviour? As an example, imagine that your professor asks everyone in your class to raise their hand if they always wash their hands after using the restroom. Chances are that almost everyone in the classroom will raise their hand, but do you think hand washing after every trip to the restroom is really that universal?
This is very similar to the phenomenon mentioned earlier in this chapter: many individuals do not feel comfortable answering a question honestly. But if we are committed to finding out the facts about hand washing, we have other options available to us.
Suppose we send a classmate into the restroom to actually watch whether everyone washes their hands after using the restroom. Will our observer blend into the restroom environment by wearing a white lab coat, sitting with a clipboard, and staring at the sinks? We want our researcher to be inconspicuous—perhaps standing at one of the sinks pretending to put in contact lenses while secretly recording the relevant information. This type of observational study is called naturalistic observation: observing behaviour in its natural setting. To better understand peer exclusion, Suzanne Fanger collaborated with colleagues at the University of Texas to observe the behaviour of preschool children on a playground. How did the observers remain inconspicuous over the duration of the study? They equipped a few of the children with wireless microphones (which the children quickly forgot about) and observed while taking notes from a distance. Also, the children in that particular preschool (a “laboratory preschool”) were accustomed to having observers on the playground (Fanger et al., 2012).
It is critical that the observer be as unobtrusive and as inconspicuous as possible: when people know they are being watched, they are less likely to behave naturally. If you have any doubt about this, ask yourself how your driving behaviour might differ in two situations: In the first situation, you are driving down a deserted highway during the middle of the day; in the second situation, you are being followed by a police car down the same deserted highway (Figure 2.6).
It should be pointed out that naturalistic observation is not limited to research involving humans. Indeed, some of the best-known examples of naturalistic observation involve researchers going into the field to observe various kinds of animals in their own environments. As with human studies, the researchers maintain their distance and avoid interfering with the animal subjects so as not to influence their natural behaviours. Scientists have used this technique to study social hierarchies and interactions among animals ranging from ground squirrels to gorillas. The information provided by these studies is invaluable in understanding how those animals organize socially and communicate with one another. The anthropologist Jane Goodall, for example, spent nearly five decades observing the behaviour of chimpanzees in Africa (Figure 2.7). As an illustration of the types of concerns that a researcher might encounter in naturalistic observation, some scientists criticized Goodall for giving the chimps names instead of referring to them by numbers—using names was thought to undermine the emotional detachment required for the objectivity of the study (McKie, 2010).
The greatest benefit of naturalistic observation is the validity, or accuracy, of information collected unobtrusively in a natural setting. Having individuals behave as they normally would in a given situation means that we have a higher degree of ecological validity, or realism, than we might achieve with other research approaches. Therefore, our ability to generalize the findings of the research to real-world situations is enhanced. If done correctly, we need not worry about people or animals modifying their behaviour simply because they are being observed. Sometimes, people may assume that reality programs give us a glimpse into authentic human behaviour. However, the principle of inconspicuous observation is violated as reality stars are followed by camera crews and are interviewed on camera for personal confessionals. Given that environment, we must doubt how natural and realistic their behaviours are.
The major downside of naturalistic observation is that they are often difficult to set up and control. In our restroom study, what if you stood in the restroom all day prepared to record people’s hand washing behaviour and no one came in? Or, what if you have been closely observing a troop of gorillas for weeks only to find that they migrated to a new place while you were sleeping in your tent? The benefit of realistic data comes at a cost. As a researcher you have no control of when (or if) you have behaviour to observe. In addition, this type of observational research often requires significant investments of time, money, and a good dose of luck.
Sometimes studies involve structured observation. In these cases, people are observed while engaging in set, specific tasks. An excellent example of structured observation comes from Strange Situation by Mary Ainsworth (you will read more about this in the chapter on lifespan development). The Strange Situation is a procedure used to evaluate attachment styles that exist between an infant and caregiver. In this scenario, caregivers bring their infants into a room filled with toys. The Strange Situation involves a number of phases, including a stranger coming into the room, the caregiver leaving the room, and the caregiver’s return to the room. The infant’s behaviour is closely monitored at each phase, but it is the behaviour of the infant upon being reunited with the caregiver that is most telling in terms of characterizing the infant’s attachment style with the caregiver.
Another potential problem in observational research is observer bias. Generally, people who act as observers are closely involved in the research project and may unconsciously skew their observations to fit their research goals or expectations. To protect against this type of bias, researchers should have clear criteria established for the types of behaviours recorded and how those behaviours should be classified. In addition, researchers often compare observations of the same event by multiple observers, in order to test inter-rater reliability: a measure of reliability that assesses the consistency of observations by different observers.
Surveys
Often, psychologists develop surveys as a means of gathering data. Surveys are lists of questions to be answered by research participants, and can be delivered as paper-and-pencil questionnaires, administered electronically, or conducted verbally (Figure 2.8). Generally, the survey itself can be completed in a short time, and the ease of administering a survey makes it easy to collect data from a large number of people.
Surveys allow researchers to gather data from larger samples than may be afforded by other research methods. A sample is a subset of individuals selected from a population, which is the overall group of individuals that the researchers are interested in. Researchers study the sample and seek to generalize their findings to the population. Generally, researchers will begin this process by calculating various measures of central tendency from the data they have collected. These measures provide an overall summary of what a typical response looks like. There are three measures of central tendency: mode, median, and mean. The mode is the most frequently occurring response, the median lies at the middle of a given data set, and the mean is the arithmetic average of all data points. Means tend to be most useful in conducting additional analyses like those described below; however, means are very sensitive to the effects of outliers, and so one must be aware of those effects when making assessments of what measures of central tendency tell us about a data set in question.
There is both strength and weakness of the survey in comparison to case studies. By using surveys, we can collect information from a larger sample of people. A larger sample is better able to reflect the actual diversity of the population, thus allowing better generalizability. Therefore, if our sample is sufficiently large and diverse, we can assume that the data we collect from the survey can be generalized to the larger population with more certainty than the information collected through a case study. However, given the greater number of people involved, we are not able to collect the same depth of information on each person that would be collected in a case study.
Another potential weakness of surveys is something we touched on earlier in this chapter: People don’t always give accurate responses. They may lie, misremember, or answer questions in a way that they think makes them look good. For example, people may report drinking less alcohol than is actually the case.
Any number of research questions can be answered through the use of surveys. One real-world example is the research conducted by Jenkins and colleagues (2012) about the backlash against the US Arab-American community following the terrorist attacks of September 11, 2001. Jenkins and colleagues wanted to determine to what extent these negative attitudes toward Arab-Americans still existed nearly a decade after the attacks occurred. In one study, 140 research participants filled out a survey with 10 questions, including questions asking directly about the participant’s overt prejudicial attitudes toward people of various ethnicities. The survey also asked indirect questions about how likely the participant would be to interact with a person of a given ethnicity in a variety of settings (such as, “How likely do you think it is that you would introduce yourself to a person of Arab-American descent?”). The results of the research suggested that participants were unwilling to report prejudicial attitudes toward any ethnic group. However, there were significant differences between their pattern of responses to questions about social interaction with Arab-Americans compared to other ethnic groups: they indicated less willingness for social interaction with Arab-Americans compared to the other ethnic groups. This suggested that the participants harboured subtle forms of prejudice against Arab-Americans, despite their assertions that this was not the case (Jenkins et al., 2012).
Archival Research
Some researchers gain access to large amounts of data without interacting with a single research participant. Instead, they use existing records to answer various research questions. This type of research approach is known as archival research. Archival research relies on looking at past records or data sets to look for interesting patterns or relationships.
For example, a researcher might access the academic records of all individuals who enrolled in college within the past ten years and calculate how long it took them to complete their degrees, as well as course loads, grades, and extracurricular involvement. Archival research could provide important information about who is most likely to complete their education, and it could help identify important risk factors for struggling students (Figure 2.9).
In comparing archival research to other research methods, there are several important distinctions. For one, the researcher employing archival research never directly interacts with research participants. Therefore, the investment of time and money to collect data is considerably less with archival research. Additionally, researchers have no control over what information was originally collected. Therefore, research questions have to be tailored so they can be answered within the structure of the existing data sets. There is also no guarantee of consistency between the records from one source to another, which might make comparing and contrasting different data sets problematic.
Longitudinal and Cross-Sectional Research
Sometimes we want to see how people change over time, as in studies of human development and lifespan. When we test the same group of individuals repeatedly over an extended period of time, we are conducting longitudinal research. Longitudinal research is a research design in which data-gathering is administered repeatedly over an extended period of time. For example, we may survey a group of individuals about their dietary habits at age 20, retest them a decade later at age 30, and then again at age 40.
Another approach is cross-sectional research. In cross-sectional research, a researcher compares multiple segments of the population at the same time. Using the dietary habits example above, the researcher might directly compare different groups of people by age. Instead of studying a group of people for 20 years to see how their dietary habits changed from decade to decade, the researcher would study a group of 20-year-old individuals and compare them to a group of 30-year-old individuals and a group of 40-year-old individuals. While cross-sectional research requires a shorter-term investment, it is also limited by differences that exist between the different generations (or cohorts) that have nothing to do with age per se, but rather reflect the social and cultural experiences of different generations of individuals make them different from one another.
To illustrate this concept, consider the following survey findings. In recent years there has been significant growth in the popular support of same-sex marriage. Many studies on this topic break down survey participants into different age groups. In general, younger people are more supportive of same-sex marriage than are those who are older (Jones, 2013). Does this mean that as we age we become less open to the idea of same-sex marriage, or does this mean that older individuals have different perspectives because of the social climates in which they grew up? Longitudinal research is a powerful approach because the same individuals are involved in the research project over time, which means that the researchers need to be less concerned with differences among cohorts affecting the results of their study.
Often longitudinal studies are employed when researching various diseases in an effort to understand particular risk factors. Such studies often involve tens of thousands of individuals who are followed for several decades. Given the enormous number of people involved in these studies, researchers can feel confident that their findings can be generalized to the larger population. The Cancer Prevention Study-3 (CPS-3) is one of a series of longitudinal studies sponsored by the American Cancer Society aimed at determining predictive risk factors associated with cancer. When participants enter the study, they complete a survey about their lives and family histories, providing information on factors that might cause or prevent the development of cancer. Then every few years the participants receive additional surveys to complete. In the end, hundreds of thousands of participants will be tracked over 20 years to determine which of them develop cancer and which do not.
Clearly, this type of research is important and potentially very informative. For instance, earlier longitudinal studies sponsored by the American Cancer Society provided some of the first scientific demonstrations of the now well-established links between increased rates of cancer and smoking (American Cancer Society, n.d.) (Figure 2.10).
As with any research strategy, longitudinal research is not without limitations. For one, these studies require an incredible time investment by the researcher and research participants. Given that some longitudinal studies take years, if not decades, to complete, the results will not be known for a considerable period of time. In addition to the time demands, these studies also require a substantial financial investment. Many researchers are unable to commit the resources necessary to see a longitudinal project through to the end.
Research participants must also be willing to continue their participation for an extended period of time, and this can be problematic. People move, get married and take new names, get ill, and eventually die. Even without significant life changes, some people may simply choose to discontinue their participation in the project. As a result, the attrition rates, or reduction in the number of research participants due to dropouts, in longitudinal studies are quite high and increases over the course of a project. For this reason, researchers using this approach typically recruit many participants fully expecting that a substantial number will drop out before the end. As the study progresses, they continually check whether the sample still represents the larger population, and make adjustments as necessary.
TRICKY TOPICS: MEASURING BEHAVIOUR
If the video above does not load, click here: https://youtu.be/gLPQUlmI6So
Learning Objectives
By the end of this section, you will be able to:
- Explain what a correlation coefficient tells us about the relationship between variables
- Recognize that correlation does not indicate a cause-and-effect relationship between variables
- Discuss our tendency to look for relationships between variables that do not really exist
- Explain random sampling and assignment of participants into experimental and control groups
- Discuss how experimenter or participant bias could affect the results of an experiment
- Identify independent and dependent variables
Did you know that as sales in ice cream increase, so does the overall rate of crime? Is it possible that indulging in your favourite flavour of ice cream could send you on a crime spree? Or, after committing crime do you think you might decide to treat yourself to a cone? There is no question that a relationship exists between ice cream and crime (e.g., Harper, 2013), but it would be pretty foolish to decide that one thing actually caused the other to occur.
It is much more likely that both ice cream sales and crime rates are related to the temperature outside. When the temperature is warm, there are lots of people out of their houses, interacting with each other, getting annoyed with one another, and sometimes committing crimes. Also, when it is warm outside, we are more likely to seek a cool treat like ice cream. How do we determine if there is indeed a relationship between two things? And when there is a relationship, how can we discern whether it is attributable to coincidence or causation?
Correlational Research
TRICKY TOPIC: CORRELATIONAL RESEARCH
If the video above does not load, click here: https://www.youtube.com/watch?v=9YTYuQa8p-U&feature=youtu.be
For a full transcript of this video, click here
Correlation means that there is a relationship between two or more variables (such as ice cream consumption and crime), but this relationship does not necessarily imply cause and effect. When two variables are correlated, it simply means that as one variable changes, so does the other. We can measure correlation by calculating a statistic known as a correlation coefficient. A correlation coefficient is a number from -1 to +1 that indicates the strength and direction of the relationship between variables. The correlation coefficient is usually represented by the letter r.
The number portion of the correlation coefficient indicates the strength of the relationship. The closer the number is to 1 (be it negative or positive), the more strongly related the variables are, and the more predictable changes in one variable will be as the other variable changes. The closer the number is to zero, the weaker the relationship, and the less predictable the relationships between the variables becomes. For instance, a correlation coefficient of 0.9 indicates a far stronger relationship than a correlation coefficient of 0.3. If the variables are not related to one another at all, the correlation coefficient is 0. The example above about ice cream and crime is an example of two variables that we might expect to have no relationship to each other.
The sign—positive or negative—of the correlation coefficient indicates the direction of the relationship (Figure 2.11). A positive correlation means that the variables move in the same direction. Put another way, it means that as one variable increases so does the other, and conversely, when one variable decreases so does the other. A negative correlation means that the variables move in opposite directions. If two variables are negatively correlated, a decrease in one variable is associated with an increase in the other and vice versa.
The example of ice cream and crime rates is a positive correlation because both variables increase when temperatures are warmer. Other examples of positive correlations are the relationship between an individual’s height and weight or the relationship between a person’s age and number of wrinkles. One might expect a negative correlation to exist between someone’s tiredness during the day and the number of hours they slept the previous night: the amount of sleep decreases as the feelings of tiredness increase. In a real-world example of negative correlation, student researchers at the University of Minnesota found a weak negative correlation (r = -0.29) between the average number of days per week that students got fewer than 5 hours of sleep and their GPA (Lowry et al., 2010). Keep in mind that a negative correlation is not the same as no correlation. For example, we would probably find no correlation between hours of sleep and shoe size.
As mentioned earlier, correlations have predictive value. Imagine that you are on the admissions committee of a major university. You are faced with a huge number of applications, but you are able to accommodate only a small percentage of the applicant pool. How might you decide who should be admitted? You might try to correlate your current students’ college GPA with their scores on standardized tests like the SAT or ACT. By observing which correlations were strongest for your current students, you could use this information to predict relative success of those students who have applied for admission into the university.
LINK TO LEARNING
Manipulate this interactive scatterplot to practice your understanding of positive and negative correlation.
Correlation Does Not Indicate Causation
Correlational research is useful because it allows us to discover the strength and direction of relationships that exist between two variables. However, correlation is limited because establishing the existence of a relationship tells us little about cause and effect. While variables are sometimes correlated because one does cause the other, it could also be that some other factor, a confounding variable, is actually causing the systematic movement in our variables of interest. In the ice cream/crime rate example mentioned earlier, temperature is a confounding variable that could account for the relationship between the two variables.
Even when we cannot point to clear confounding variables, we should not assume that a correlation between two variables implies that one variable causes changes in another. This can be frustrating when a cause-and-effect relationship seems clear and intuitive. Think back to our discussion of the research done by the American Cancer Society and how their research projects were some of the first demonstrations of the link between smoking and cancer. It seems reasonable to assume that smoking causes cancer, but if we were limited to correlational research, we would be overstepping our bounds by making this assumption.
Unfortunately, people mistakenly make claims of causation as a function of correlations all the time. Such claims are especially common in advertisements and news stories. For example, recent research found that people who eat cereal on a regular basis achieve healthier weights than those who rarely eat cereal (Barton et al., 2005; Frantzen et al., 2013). Guess how the cereal companies report this finding. Does eating cereal really cause an individual to maintain a healthy weight, or are there other possible explanations, such as, someone at a healthy weight is more likely to regularly eat a healthy breakfast than someone who is obese or someone who avoids meals in an attempt to diet (Figure 2.12)? While correlational research is invaluable in identifying relationships among variables, a major limitation is the inability to establish causality. Psychologists want to make statements about cause and effect, but the only way to do that is to conduct an experiment to answer a research question. The next section describes how scientific experiments incorporate methods that eliminate, or control for, alternative explanations, which allow researchers to explore how changes in one variable cause changes in another variable.
Illusory Correlations
The temptation to make erroneous cause-and-effect statements based on correlational research is not the only way we tend to misinterpret data. We also tend to make the mistake of illusory correlations, especially with unsystematic observations. Illusory correlations, or false correlations, occur when people believe that relationships exist between two things when no such relationship exists. One well-known illusory correlation is the supposed effect that the moon’s phases have on human behaviour. Many people passionately assert that human behaviour is affected by the phase of the moon, and specifically, that people act strangely when the moon is full (Figure 2.13).
There is no denying that the moon exerts a powerful influence on our planet. The ebb and flow of the ocean’s tides are tightly tied to the gravitational forces of the moon. Many people believe, therefore, that it is logical that we are affected by the moon as well. After all, our bodies are largely made up of water. A meta-analysis of nearly 40 studies consistently demonstrated, however, that the relationship between the moon and our behaviour does not exist (Rotton & Kelly, 1985). While we may pay more attention to odd behaviour during the full phase of the moon, the rates of odd behaviour remain constant throughout the lunar cycle.
Why are we so apt to believe in illusory correlations like this? Often we read or hear about them and simply accept the information as valid. Or, we have a hunch about how something works and then look for evidence to support that hunch, ignoring evidence that would tell us our hunch is false; this is known as confirmation bias. Other times, we find illusory correlations based on the information that comes most easily to mind, even if that information is severely limited. And while we may feel confident that we can use these relationships to better understand and predict the world around us, illusory correlations can have significant drawbacks. For example, research suggests that illusory correlations—in which certain behaviours are inaccurately attributed to certain groups—are involved in the formation of prejudicial attitudes that can ultimately lead to discriminatory behaviour (Fiedler, 2004).
Causality: Conducting Experiments and Using the Data
As you’ve learned, the only way to establish that there is a cause-and-effect relationship between two variables is to conduct a scientific experiment. Experiment has a different meaning in the scientific context than in everyday life. In everyday conversation, we often use it to describe trying something for the first time, such as experimenting with a new hair style or a new food. However, in the scientific context, an experiment has precise requirements for design and implementation.
TRICKY TOPIC: EXPERIMENTAL RESEARCH
If the video above does not load, click here: https://www.youtube.com/watch?v=9YTYuQa8p-U&feature=youtu.be
For a full transcript of this video, click here
The Experimental Hypothesis
In order to conduct an experiment, a researcher must have a specific hypothesis to be tested. As you’ve learned, hypotheses can be formulated either through direct observation of the real world or after careful review of previous research. If you’ve ever spent time with a young child in a car you may have seen them mimicking the actions of the adult driving, pretending to turn the steering wheel or honk the horn. You may have also seen this kind of imitation in less neutral contexts, like a child repeating offensive language that they clearly don’t understand. Based on this observation, it would be reasonable to think that children have a tendency to imitate behaviour they observe from others. You might make further observations from here, for example you might notice that children more often imitate behaviours performed by adults rather than other children, or that this tendency for imitation could facilitate the development of aggressive behaviours in children.

These sorts of personal observations are what often lead us to formulate a specific hypothesis, but we cannot use limited personal observations and anecdotal evidence to rigorously test our hypothesis. Instead, to find out if real-world data supports our hypothesis, we have to conduct an experiment.
Designing an Experiment
The most basic experimental design involves two groups: the experimental group and the control group. The two groups are designed to be the same except for one difference— experimental manipulation. The experimental group gets the experimental manipulation—that is, the treatment or variable being tested (in this case, the use of technology)—and the control group does not. Since experimental manipulation is the only difference between the experimental and control groups, we can be sure that any differences between the two are due to experimental manipulation rather than chance.
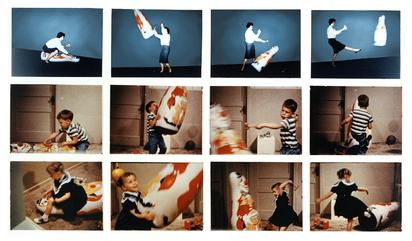
To investigate the relationship between observed aggression and imitated aggressive behaviour in children, our experimental manipulation will be to allow children to observe an adult modeling aggressive behaviour. We might have the children in our experimental group play in a room where they are able to observe adults playing aggressively with toys, hitting, pushing and yelling at them. The study we are describing here is actually a simplified version of the famous 1961 Bobo doll study performed by Albert Bandura, Dorothea Ross, and Sheila A. Ross, named as such because the toy used to demonstrate aggression was an inflatable clown doll called Bobo. We will touch more on work done by Bandura in greater detail in section 57 on observational learning.
We’ve decided our experimental condition will involve allowing children to observe adults modelling aggressive behaviour, we now need to design a control group that differs only by a lack of exposure to aggressive adult models. The original version of the Bobo doll study had a control group that did not observe any behaviour at all. Knowing what you now know about experimental design, would you design your control group in the same way? If a control group is meant to differ from an experimental group only in terms of the experimental manipulation, you might argue that a group exposed to nothing differs in several ways. For example, the experience of being made to sit in a room with a strange adult could theoretically provoke acts of aggression in young children. It might seem far-fetched, but we cannot infer that observation of aggression was the cause of our participant’s behaviour if we don’t rule out the possibility that other features of our manipulation could have contributed. The researchers used a second experimental group to rule out this possibility, but for the purposes of our hypothetical replication we have an experimental group who observe adults behaving aggressively with toys, and a control group who observe adults behaving non-aggressively with the same toys.
One of the most important parts of a scientific study is having a clear description of how each variable is measured, known as an operational definition. Some variables, like age and height, are easy to define, but psychologists are often interested in measuring abstract variables like thought, emotion, and behaviour which can be challenging. For example, can you operationally define helpfulness? People vary in how helpful they are, so there must be some way to measure this. This could be measured by looking at charitable donations on annual tax returns, but that’s only one type of helpfulness and is biased towards wealthier individuals. What about number of hours per week volunteering? This operational definition also has its limitations in capturing helping behaviour. In our Bobo doll study, we will have to define aggression, which could be described in a variety of ways. For example, one might define aggression as hostile, injurious, or destructive behaviour caused by frustration. However, this definition would require us to also measure frustration, as this feature is not externally observable. Researchers often create different operational definitions of the same variable, so providing a clear, measurable description is important in interpreting research findings.
While it is possible to measure frustration through self-report, our study is interested in imitative aggression, and we do not know that imitative aggression is caused by frustration. So for the purposes of our hypothetical experiment, we could define aggressive behaviour as physical or verbal acts that have the potential to cause harm to an object or another human. We could then describe specific, observable aggressive behaviours like kicking the doll, throwing it, or saying things like “stupid doll”. Our adult models could perform these specific behaviours, and we could measure the rate at which participants imitate those acts when given an opportunity to play with the same doll later. The imitation of those previously described acts would be considered imitative aggression. Having defined our variables like this, we are able to communicate specifically what we have measured, which makes it easier for other researchers to replicate our experiment and check our results.
We’ve operationalized our variables, so now we can decide how our experiment will run. In this case, we could allow our participants to play in a room with an adult model who would perform a set of specifically defined behaviours (either aggressive or non-aggressive) to a doll. We could then move our participants to a different room with the same set of toys and count how many of those specifically defined behaviours they reproduce.
Ideally, the people who count imitated behaviours are unaware of who was assigned to the experimental or control group, in order to control for experimenter bias. Experimenter bias refers to the possibility that a researcher’s expectations might skew the results of the study. Remember, conducting an experiment requires a lot of planning, and the people involved in the research project have a vested interest in supporting their hypotheses. If the observers knew which child was in which group, it might influence how they interpret ambiguous responses, such as squeezing the doll. By being blind to which child is in which group, we protect against those biases. This situation is a single-blind study, meaning that one of the groups (participants) are unaware as to which group they are in (experiment or control group) while the researcher who developed the experiment knows which participants are in each group.
In a double-blind study, both the researchers and the participants are blind to group assignments, which allows us to control for both experimenter and participant expectations. A well-known example of this is the placebo effect, which occurs when people’s expectations or beliefs influence or determine their experience in a given situation. In other words, simply expecting something to happen can actually make it happen.
To illustrate, imagine that you have bad allergies and are taking part in a study testing a new allergy medication. You go to a university or hospital setting to take part in the experiment, speaking to people in lab coats with medical authority who do a number of tests on you and then give you a pill. Whether the pill contains actual medication or not, the experience of taking part and receiving the pill may give the treatment a sense of legitimacy. You may feel hopeful and proactive about your bad allergies, and as a result you may notice an actual improvement in symptoms even if you only took a sugar pill.
As we know, we can only say that our experimental manipulation (in this case the medication) is the cause of our results if it is the only difference between the experimental and control groups. As a result, we might use a placebo control, where the only difference between the two groups would be the contents of the pill- medicine or something inert. To ensure that all other conditions are the same, participants must not know whether they have received the drug- if they knew, we wouldn’t be able to tell whether the effects were due to expectations about drug efficacy or to the actual drug. Similarly, if the researchers know which drug participants are receiving they might treat participants differently, which could alter the way participants respond (Figure 2.16).
In a research experiment, we strive to study whether changes in one thing cause changes in another. To achieve this, we must pay attention to two important variables, or things that can be changed, in any experimental study: the independent variable and the dependent variable. An independent variable is manipulated or controlled by the experimenter. In a well-designed experimental study, the independent variable is the only important difference between the experimental and control groups. In our example of how the observation of aggressive behaviour affects later behaviour, the independent variable is the type of behaviour observed by the participants. (Figure 2.17). A dependent variable is what the researcher measures to see how much effect the independent variable had. In our example, the dependent variable is the number of modelled aggressive behaviours our participants imitate.
We expect that the dependent variable will change as a function of the independent variable. In other words, the dependent variable depends on the independent variable. A good way to think about the relationship between the independent and dependent variables is with this question: What effect does the independent variable have on the dependent variable? In our example of how the observation of aggressive behaviour affects later behaviour, the independent variable is the type of behaviour observed by the participants.
Selecting and Assigning Experimental Participants
Now that our study is designed, we need to obtain a sample of individuals to include in our experiment. Our study involves human participants so we need to determine who to include. Participants are the subjects of psychological research, and as the name implies, individuals who are involved in psychological research actively participate in the process. Often, psychological research projects rely on college students to serve as participants. In fact, the vast majority of research in psychology subfields has historically involved students as research participants (Sears, 1986; Arnett, 2008). But are college students truly representative of the general population? College students tend to be younger, more educated, more liberal, and less diverse than the general population. Although using students as test subjects is an accepted practice, relying on such a limited pool of research participants can be problematic because it is difficult to generalize findings to the larger population.
Our hypothetical experiment involves preschool aged children, so we need to generate a sample from that population. Samples are used because populations are usually too large to reasonably involve every member in our particular experiment (Figure 2.18). If possible, we should use a random sample (there are other types of samples, but for the purposes of this chapter, we will focus on random samples). A random sample is a subset of a larger population in which every member of the population has an equal chance of being selected. Random samples are preferred because if the sample is large enough we can be reasonably sure that the participating individuals are representative of the larger population. This means that the percentages of characteristics in the sample—sex, ethnicity, socioeconomic level, and any other characteristics that might affect the results—are close to those percentages in the larger population. Additionally, random sampling ensures that differences in characteristics are relatively balanced between groups.
In our example, we’re interested in pre-school aged children, but we can’t possibly include all pre-school aged children in our study so we need to be more specific; instead we might say our population of interest is all pre-school aged children in a particular city. We should include children from various income brackets, family situations, races, ethnicities, religions, and geographic areas of town. With this more manageable population, we can work with local preschools to select a random sample of around 200 children who we want to participate in our experiment.
In summary, because we cannot test all of the pre-school aged children in a city, we want to find a group of about 200 that reflects the composition of that city. With a representative group, we can generalize our findings to the larger population without fear of our sample being biased in some way. In the original version of this study, the sample was composed of 72 children from the Stanford University Nursery School. Can you think of some ways in which a sample drawn exclusively from a wealthy universities’ nursery school might be biased?
Now that we have a sample, the next step of the experimental process is to split the participants into experimental and control groups through random assignment. With random assignment, all participants have an equal chance of being assigned to either group. There is statistical software that will randomly assign each of the children in the sample to either the experimental or the control group.
Random assignment is critical for sound experimental design. With sufficiently large samples, random assignment makes it unlikely that there are systematic differences between the groups. So, for instance, it would be very unlikely that we would get one group composed entirely of males, a given ethnic identity, or a given religious ideology. This is important because if the groups were systematically different before the experiment began, we would not know the origin of any differences we find between the groups: Were the differences preexisting, or were they caused by manipulation of the independent variable? Even using random assignment it is possible to have groups that differ significantly from each other, so it is important to monitor any variable we think might impact our results. If we do find that a variable of interest differs significantly between groups, we can match them on that variable. Matching is a practice where participants in the experimental group are paired with participants in the control group that have similar scores on a variable of interest. For example, In the Bobo doll study participants were scored on their baseline levels of aggression. If their experimental group was found to be significantly more aggressive than their control group prior to any experimental manipulation, then they would not have been able to infer that the results were due to their manipulation. To avoid this outcome the researchers matched children in different groups with similar levels of baseline aggression, so that the groups would be roughly equivalent on that variable. Random assignment, monitoring variables, and matching allow us to assume that any differences observed between experimental and control groups result from the manipulation of the independent variable.
LINK TO LEARNING
Issues to Consider
While experiments allow scientists to make cause-and-effect claims, they are not without problems. True experiments require the experimenter to manipulate an independent variable, and that can complicate many questions that psychologists might want to address. For instance, imagine that you want to know what effect sex (the independent variable) has on spatial memory (the dependent variable). Although you can certainly look for differences between people with different biological sexes on a task that taps into spatial memory, you cannot directly control a person’s sex. We categorize this type of research approach as quasi-experimental and recognize that we cannot make cause-and-effect claims in these circumstances.
Experimenters are also limited by ethical constraints. For instance, you would not be able to conduct an experiment designed to determine if experiencing abuse as a child leads to lower levels of self-esteem among adults. To conduct such an experiment, you would need to randomly assign some experimental participants to a group that receives abuse, and that experiment would be unethical.
