1 A Regional Perspective on Poverty and Income Inequality
Across Canada, one in five children live in poverty. Indigenous and African Canadian children are disproportionately represented in these statistics: 40% of Indigenous children in Canada live in poverty, and 60% of Indigenous children on reserves live in poverty. 20% or 1 in 5 racialized families lives in poverty in Canada, as opposed to 1 in 20 non-racialized families (Canada without Poverty /Canada Sans Pauvrete, 2020).
In Nova Scotia, one in four children live in families that live in poverty (Frank, Fisher, and Saulnier, 2021). The child poverty and income inequality rate in the rural postal code of Micmac, which includes the Sipekne’katik First Nations…stands at 73.3% (p. 20). Sixty-eight postal areas in Nova Scotia have child poverty and income inequality rates at 30% and higher (p. 20). The rates vary significantly, from a low of 4.8% in Stillwater Lake, a predominantly Caucasian, prosperous suburban community in the Halifax Regional Municipality (p.40) to 50.0% in North Preston, the largest Black community in Nova Scotia, by population, also located within the Halifax Regional Municipality (p. 22).
When we talk about poverty and income inequality, there are three types of poverty that have been identified by R.W. Connell (1993): Poverty 1, the most widespread, is the poverty and income inequality that exists in rural communities in what used to be called Third World countries, but which are now more commonly referred to as non-industrialized or less-industrialized countries. These are communities that have been brought into the world capitalist economy, but are denied most of its benefits. The economies of these communities are comprised of some combination of subsistence agriculture, cash-cropping, and irregular wage labour (Connell, 1993, p. 20).
Poverty 2 describes “the poverty of urban populations in low-wage economies, a situation that includes such massive agglomerations as Mexico or Calcutta” (Connell, 1993, p.20). More recently, the country of South Africa has experienced a shift from predominantly Poverty 1 to Poverty 2, where entire village populations have moved from the rural countryside and subsistence living to shanty towns on the fringes of larger cities, hoping for waged employment and a better life.
Poverty 3 is the poverty and income inequality that results from inequalities in “high-wage economies such as Canada, the United States or Australia”, as examples (Connell, 1993, p. 20). When we talk about poverty and income inequality in Canada, and its effects on schooling for Canadian children, it is Poverty 3 that is our focus. It should be noted, however, that in recent years, there have been persuasive arguments made that residents of many Indigenous communities live in Poverty 1 situations, particularly in geographically isolated, northern areas of Canadian provinces or territories (Farooqui, 2019). These findings are supported by a report commissioned by the UN General Assembly in 2019.
As Canadian surgeon Dr. Lesley Barron recently remarked, “People most at risk of poverty and income inequality include racialized, black [sic] and Indigenous children, as well as those in lone-parent families, particularly female-led ones, and the elderly, especially women. It is also telling that people from groups who are most marginalized are also least likely be in decision-making positions in government and other institutions. The response to poverty and income inequality is too often to blame the individual. However, people make decisions based on their circumstances and often they have few choices” (Hutt, 2020).
We have been talking thus far about people who live in poverty, which is a common and convenient vernacular for what we recognize as a specific social phenomenon. However, it is not completely accurate to talk about people who live in poverty and say that Canada has no official poverty and income inequality measure. Statistics Canada actually produces three main measures of low income: the Low Income Cut-Off (LICO), the Low Income Measure (LIM), and the Market Basket Measure (MBM) (www150.statcan.gc.ca).
LICO (Low income cut-off) Measure of Poverty
In Canada, rather than a specific dollar amount being a measure of whether or not someone is “poor”, we use the Low Income Cut Off (LICO). It is a more context-specific and authentic way of measuring how people are living, (although it does have its limitations). Statistics Canada uses five sizes of community, from very rural to very urban, and seven sizes of family unit, from one person to a family with seven or more persons. In total, there are thirty-five categories. An analysis is then conducted to determine the average amount that will be spent for the necessities of living – food, shelter, and clothing. Items beyond those are not deemed necessities for living, and are not factored into the average amount spent by family units for the purposes of establishing the LICO. The following chart details Statistic Canada’s determination of the LICO scale:
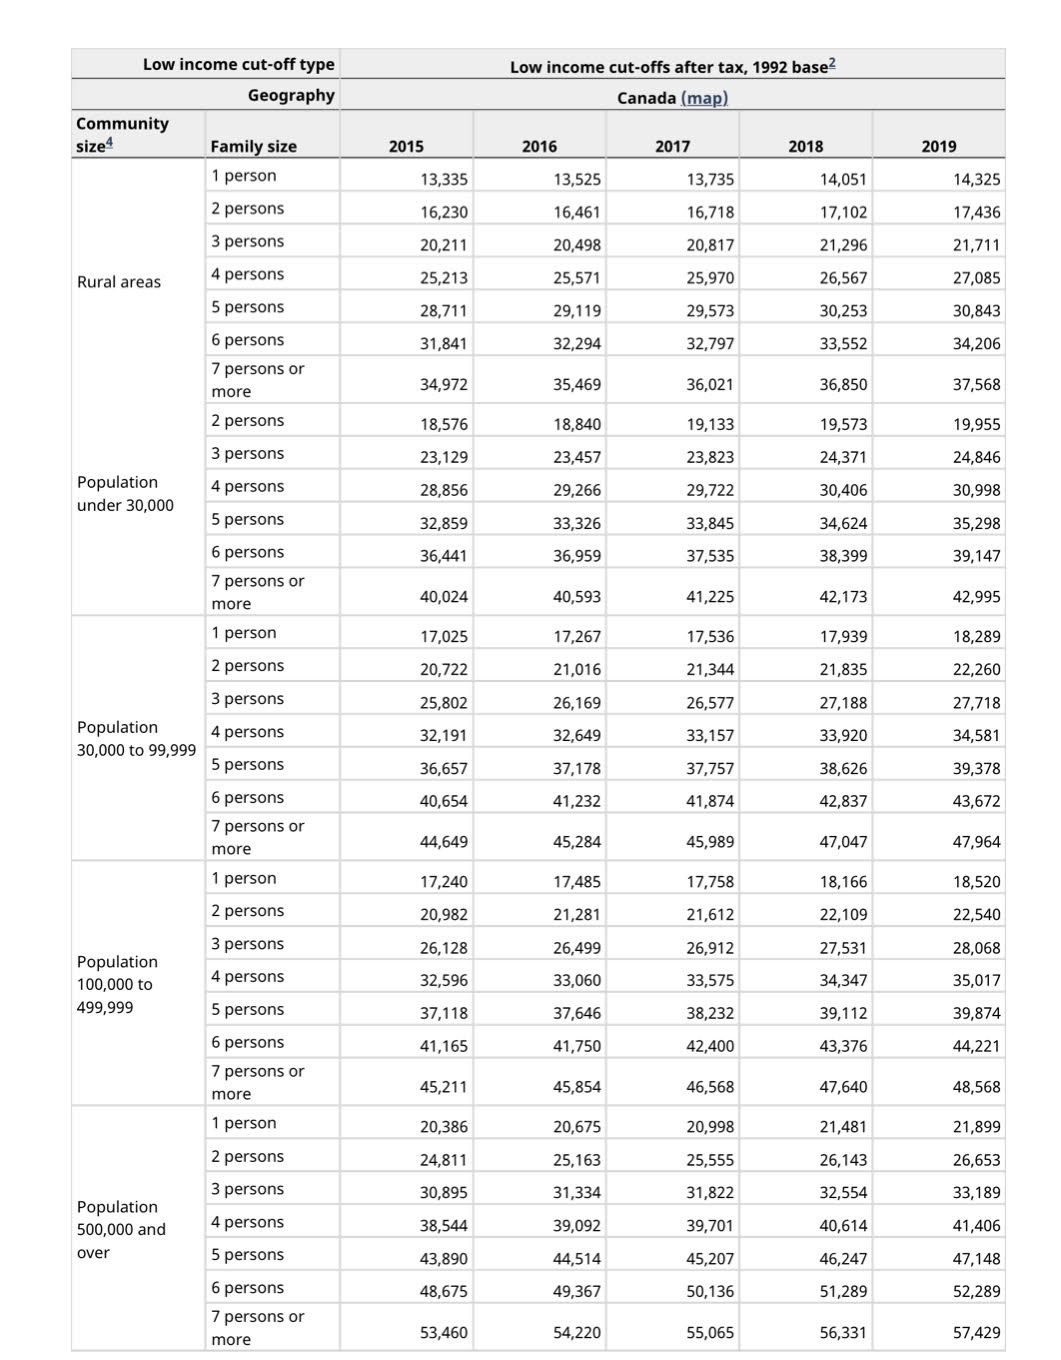
This is how it works: an average family spends 43% of its take home income on food, shelter, and clothing – the things required to sustain life. This 43% (as the average, not necessarily at all related to how much some families do actually spend) holds across family sizes and across types of communities, although of course the actual dollar amount differs for contexts (your income might be lower, but the cost of living may also be lower). Families that spend 63% or more of their take home income on these required fundamentals – food, shelter, and clothing – are understood to have met the threshold of the LICO.
A recent study commissioned by the Globe and Mail illustrates the minimum income required to afford average monthly rent in major cities across Canada. According to one commonly used metric, rent plus utilities should amount to less than 30 per cent of a tenant’s before-tax income for housing to be deemed affordable. Another general rule suggests renters should ensure their fixed costs – including but not limited to rent and utilities – are no more than 55 per cent of their after-tax income.
Average Rental Prices in Canada
A table of average rental prices for 1 and 2 bedroom apartments, and the gross annual income required to afford those rental prices based on the threshold of RENT + UTILITIES at less than 30% OF GROSS INCOME.
Source: Rentals.ca and Globe and Mail calculations based on data from Energyhub.org, Hydro-Quebec, Crown Investments Corp. of Sask., Ernst & Young tax calculator. Methodology: Utilities include electricity and heating, we assumed the landlord pays for water and other municipal services. Fixed expenses include utilities as well as tenant insurance, cellphone, broadband Internet and a $10-a-month streaming service. Income figures have been rounded up.
| Canadian City | AVG. RENT - 1 BRDM | AVG. RENT - 2 BDRM | GROSS ANNUAL INCOME REQUIRED - 1 BDRM | GROSS ANNUAL INCOME REQUIRED - 2 BDRM |
|---|---|---|---|---|
| Vancouver | $2,176 | $2,983 | $95,000 | $128,000 |
| Victoria | $1,566 | $2,453 | $71,000 | $107,000 |
| Calgary | $1,221 | $1,516 | $59,000 | $71,000 |
| Regina | $939 | $1,140 | $47,000 | $55,000 |
| Winnipeg | $1,165 | $1,454 | $54,000 | $65,000 |
| Toronto | $2,013 | $2,715 | $90,000 | $118,000 |
| Hamilton | $1,540 | $1,841 | $70,000 | $82,000 |
| Ottawa | $1,618 | $2,023 | $73,000 | $90,000 |
| Montreal | $1,507 | $1,982 | $70,000 | $89,000 |
| Halifax | $1,602 | $1,937 | $78,000 | $92,000 |
| St. John's | $959 | $1,133 | $50,000 | $57,000 |
It should be noted that the above chart and the LICO figures do not measure exactly the same things: the LICO allows only for food, shelter, and clothing, while the above chart speaks to rental costs, tenant insurance, cellphones, and internet and streaming services, but does not cover food or clothing, since it was a survey done to talk about the cost of renting across major Canadian cities. Put a different way, the above chart only suggests the amount of gross income needed to be able to afford to rent a place to live, while LICO also reflects food and clothing. Additionally, LICO uses after-tax (take-home) dollars, while the above chart uses gross (before-tax) dollars.
Let’s try to develop an example based on one family. Using Halifax, Nova Scotia, as our place of residence, the established LICO line for 2019 (the last year for which figures were established at the time of this writing), was $ 35,017 for a family of four. Remember, this is LICO – it is take home money, and it is not the total take-home: it’s the line at which LICO is established. So if your family of four in Halifax meets the LICO line, they are spending 63% or more of their take home income for food, shelter, and clothing. Let’s do the math using 63%: at 63% of take home income being spent on food, shelter, and clothing, and the LICO being met at $35,017, the take home income for this family would be approximately $57,000 (it’s a little lower, but works for here). Using just under 25% as the tax base, we can say that the gross family income for this family is $76,000 (“… in Canada the take-home pay of an average single worker, after tax and benefits, was 76.8% of their gross wage.”).
Now, this sounds like a lot of money: a lot of families in Canada do not earn $76,000 or more annually. But how do the numbers actually work? And do remember that for this example, we are using a family of four, and assuming two adults working:
|
Before tax income (two adults) |
Subtract taxes @ 23.2 % |
Take home pay |
/12 months |
Subtract $1,937 (two bedroom in Halifax) |
|
$76,000 |
$8,816 x 2 |
= $58,368 |
= $4,864 |
= $2,927 left |
But wait – there’s so much more: if we use Statistics Canada figures, the average family will spend 43% of their take home on food, shelter, and clothing. If this two-adult wage-earning family brings home $4,864 a month, then 43% of their take home salary is $2,091. This would suggest that they have $154 left per month for food and clothing. Clearly, this family will spend much more than 43% of their take home salary for the three LICO-defined necessities. In fact, if they spend that $154 on clothing, and another $972 on groceries, they have just reached the Low Income Cut Off line of 63%.
One last set of figures (for now): we were curious to know how much this couple would need to earn, at an hourly wage, not an annual income, to meet that figure of $76,000 before-tax threshold. We did some quick math, and here’s what we came up with:
$76,000 /2 = $38,000 per adult
$38,000 @ $15 per hour (the minimum wage some provinces and territories are working toward) – $587.73 (taxes @ 23.2%) = $1,945.27 take-home. This is far less than half of the $4,864 take-home figure we were using above. In fact, to reach that number – in other words, simply to reach the Low Income Cut Off line – these two adults would each need to have hourly-waged employment that pays $20 an hour. The lowest minimum wage in Canada as of this writing (February, 2022) is Saskatchewan, at $11.81 an hour. The highest is in Nunavut, at $16.00 an hour (and where, it must be noted, the cost of living is much higher than in the provinces below it). (See the Appendix One for a complete list of current and anticipated minimum wages across Canada.) And why does all of this matter? Because a loaf of bread costs the same amount regardless of whether you earn $20,000 or $200,000 a year. Rent is rent, regardless of your income. Heating costs (typically either oil or electricity) are the same regardless of family income. Clothing costs are the one variable here, but overall, the less you make, the greater the proportion of your income is spent paying for food, shelter, and clothing.
Racialized persons are defined as individuals who are non-Caucasian. Factors such as discrimination, language barriers, historical trauma and colonization can have a cumulative effect on these families.
the action or fact of maintaining or supporting oneself at a minimum level
to relegate to an unimportant or powerless position within a society or group
the language or dialect spoken by the ordinary people in a particular country or region
the influences that shape people's behavior and opinions
income threshold below which a family will likely devote a larger share of its income on the necessities of food, shelter and clothing than the average family
defines low income as being below a fixed percentage of income. A household is considered low income if its income is below 50% of median household incomes. It is, therefore, a relative measure of low income.
a measure of low income based on the cost of a specific basket of goods and services representing a modest, basic standard of living. It includes the costs of food, clothing, footwear, transportation, shelter and other expenses for a reference family of two adults (aged 25 to 49) and two children (aged 9 and 13).
is the lowest amount a worker can be legally paid for their work. Most countries have a nation-wide minimum wage that all workers must be paid. Canada's minimum wage, however, is set by each province and territory.
